over 220,000 reported accidents in 2018 across the UK
only 27% of UK drivers have a dash cam onboard
Everyday there are over 600 reported vehicle accidents, yet only 27% of drivers in the UK use dashcams. Research indicates 72% of people believe a dashcam would be beneficial. Dash, a smartphone-based dashcam and black box recorder – gives customers the benefits of a dashcam without the need for new hardware, making it more accessible to wider audiences and saving them money.
User Groups
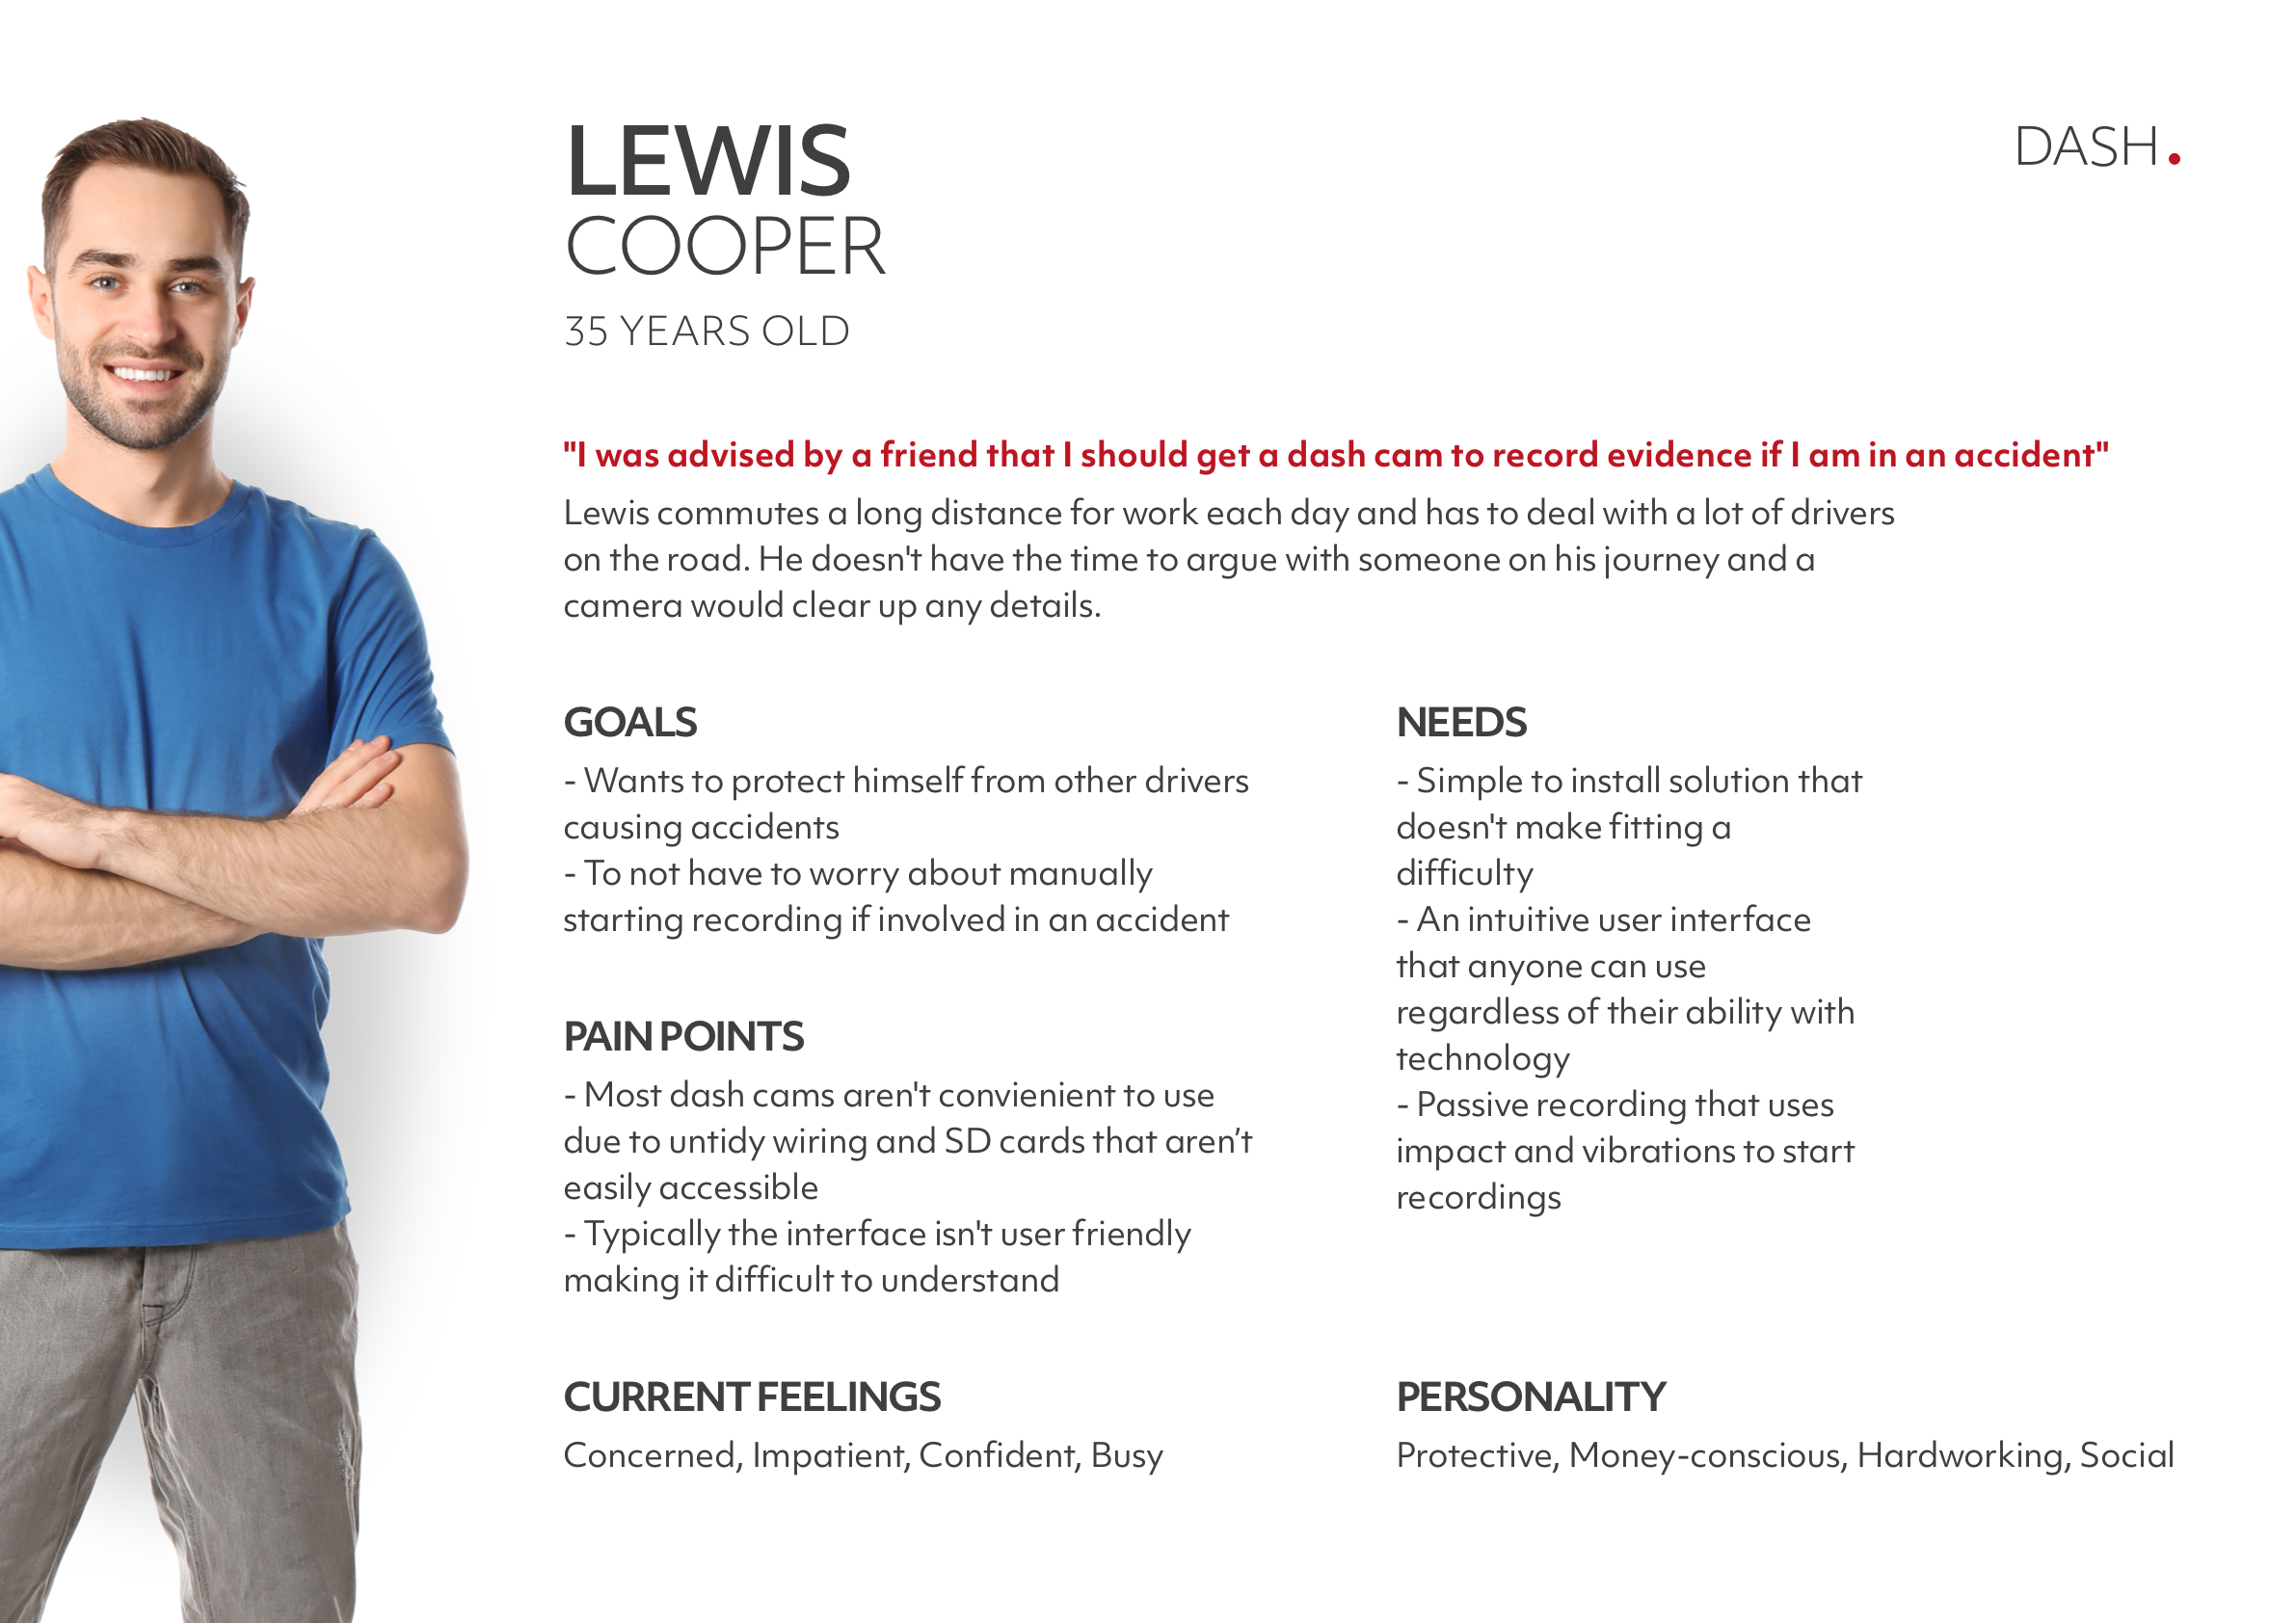
The two user groups focused on are young drivers aged between 17-24, and everyday drivers who travel regularly, commuting to and from work. I have feedback from both groups through initial surveys, posted across relevant channels, giving me further understanding around dashcams and insurance. From these surveys, a number of users expressed interest in further interviews and testing to gain more insight in the specifics of Dash. On top of these direct user groups, another opportunity exists to collect data regarding road surface quality across cities, with this information being sold back to local councils.

25%
25% of drivers under 22 have been involved in an accident *
* based on Dash survey
33%
33% of young drivers use a black box app *
66%
66% of everyday drivers have a dash cam in their vehicle *
70%
70% of everyday drivers felt a dash cam was beneficial *
* based on Dash survey
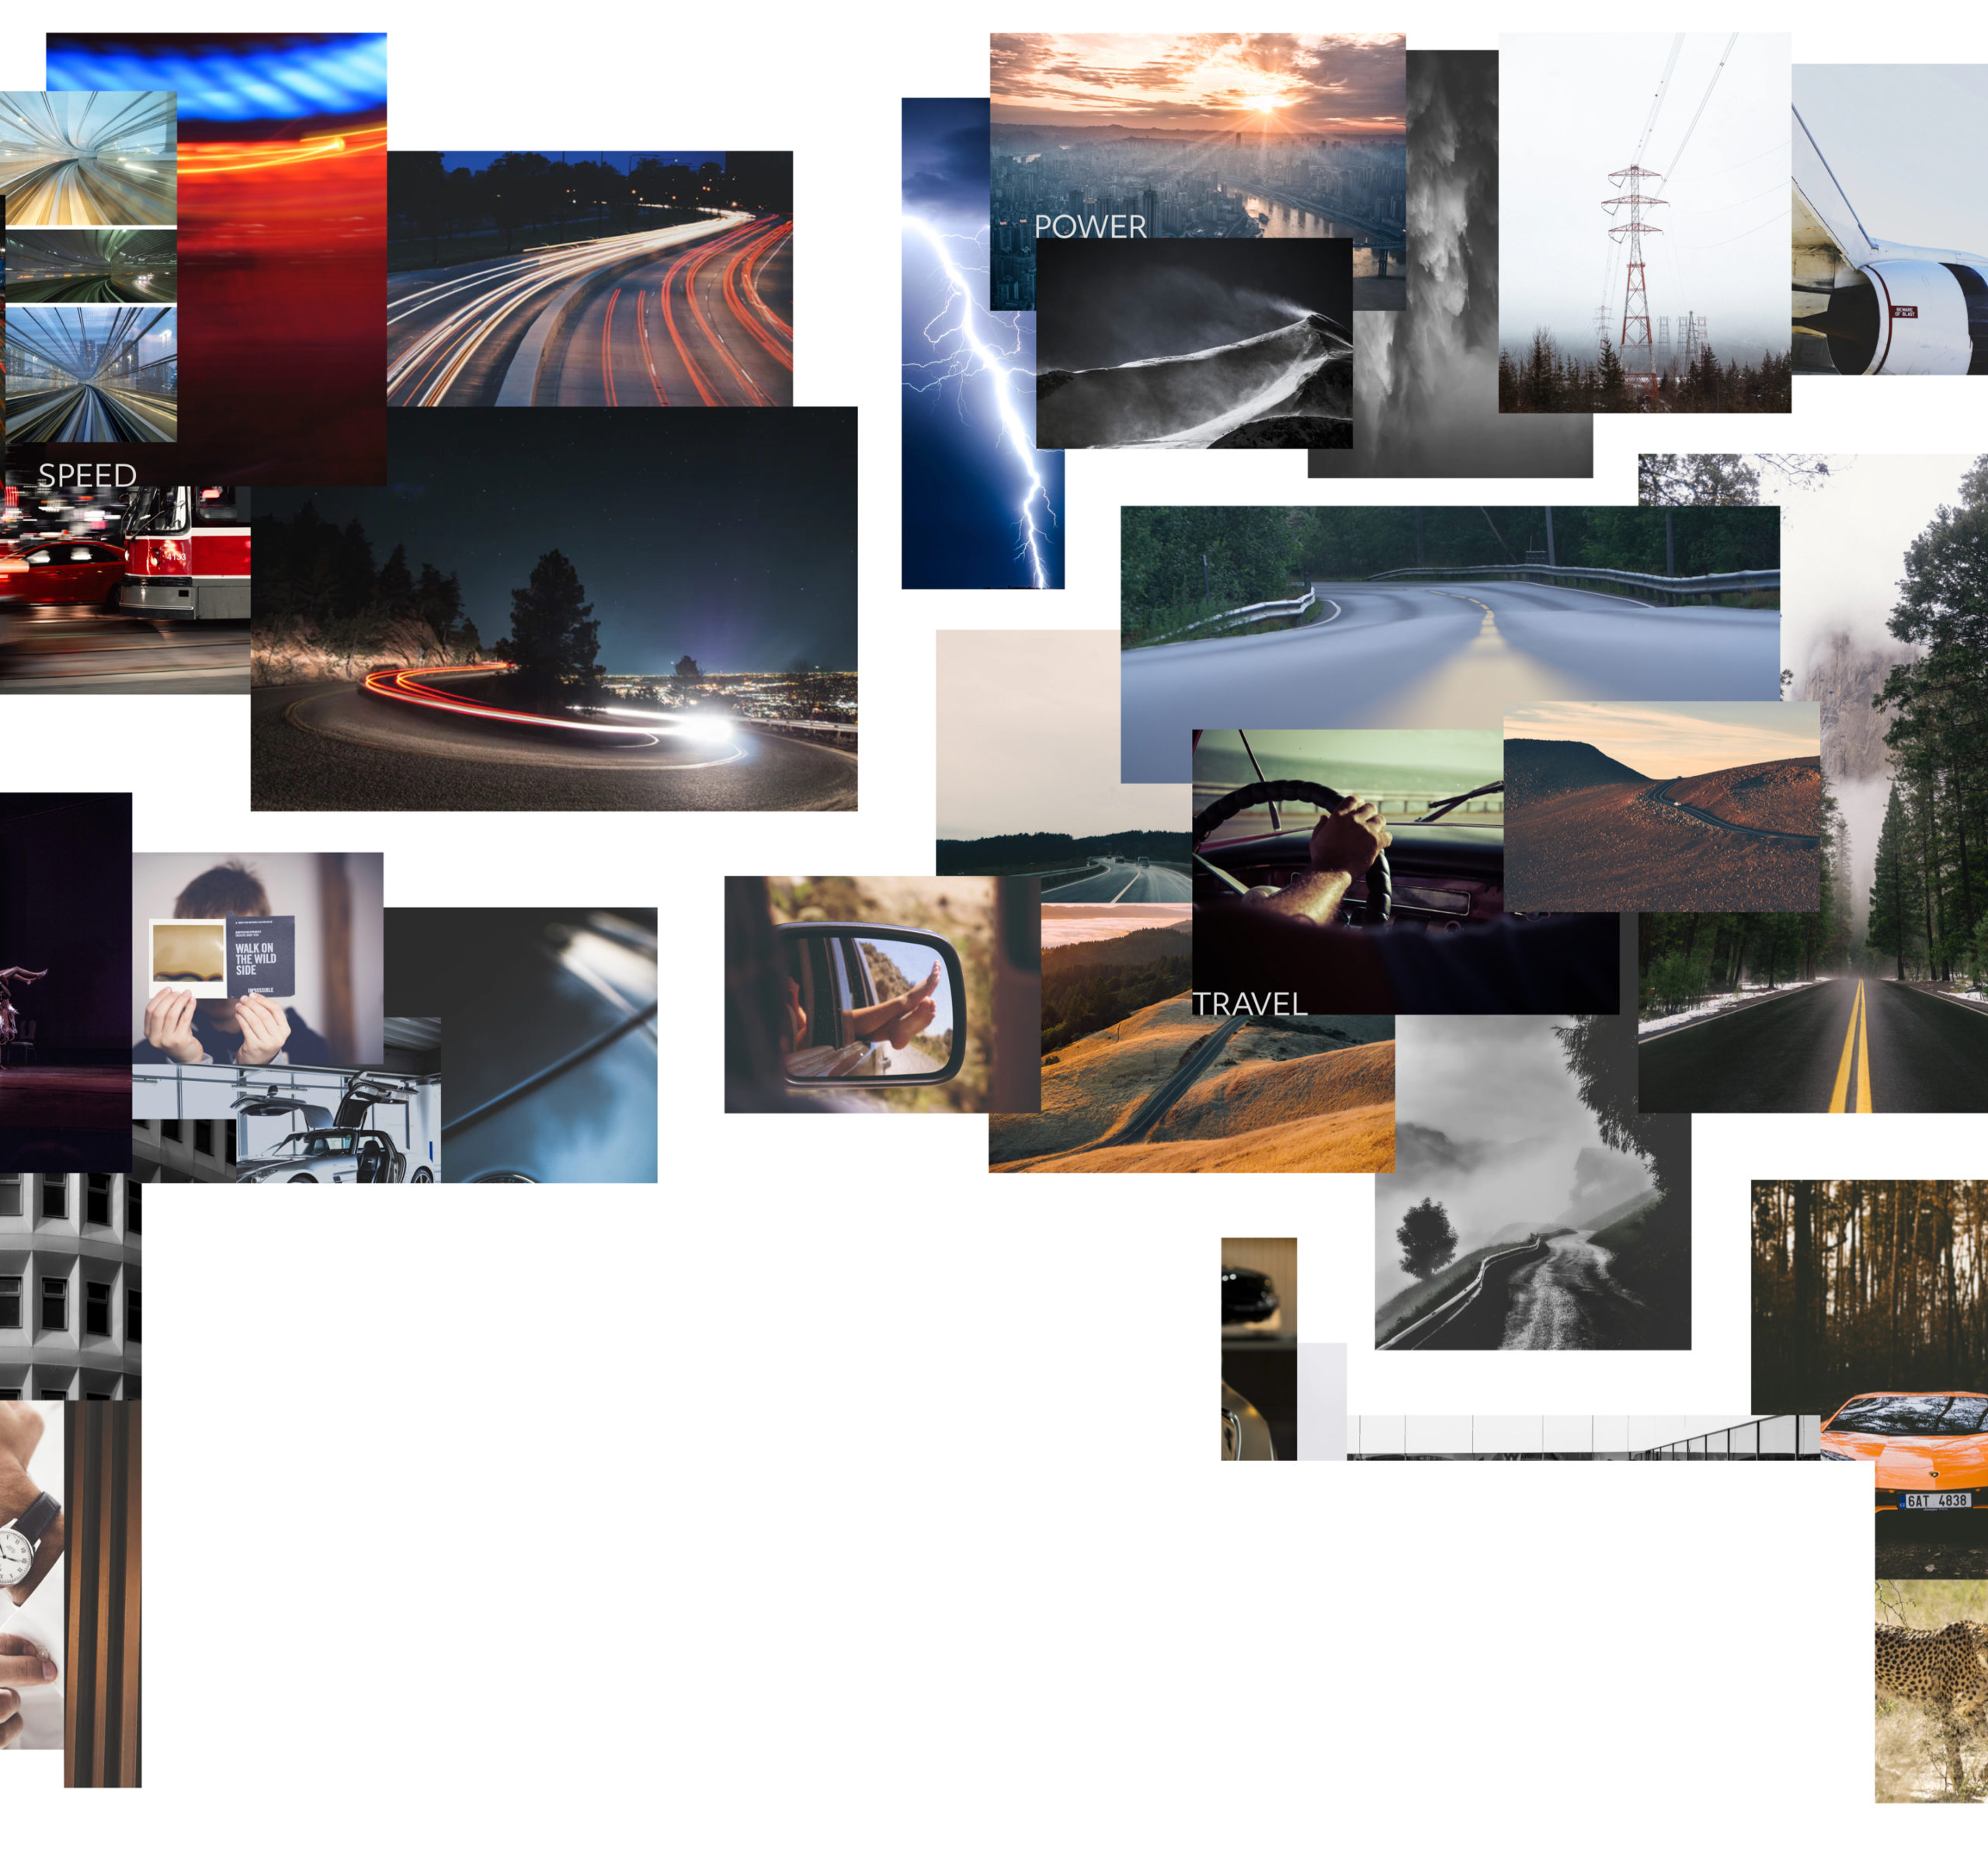

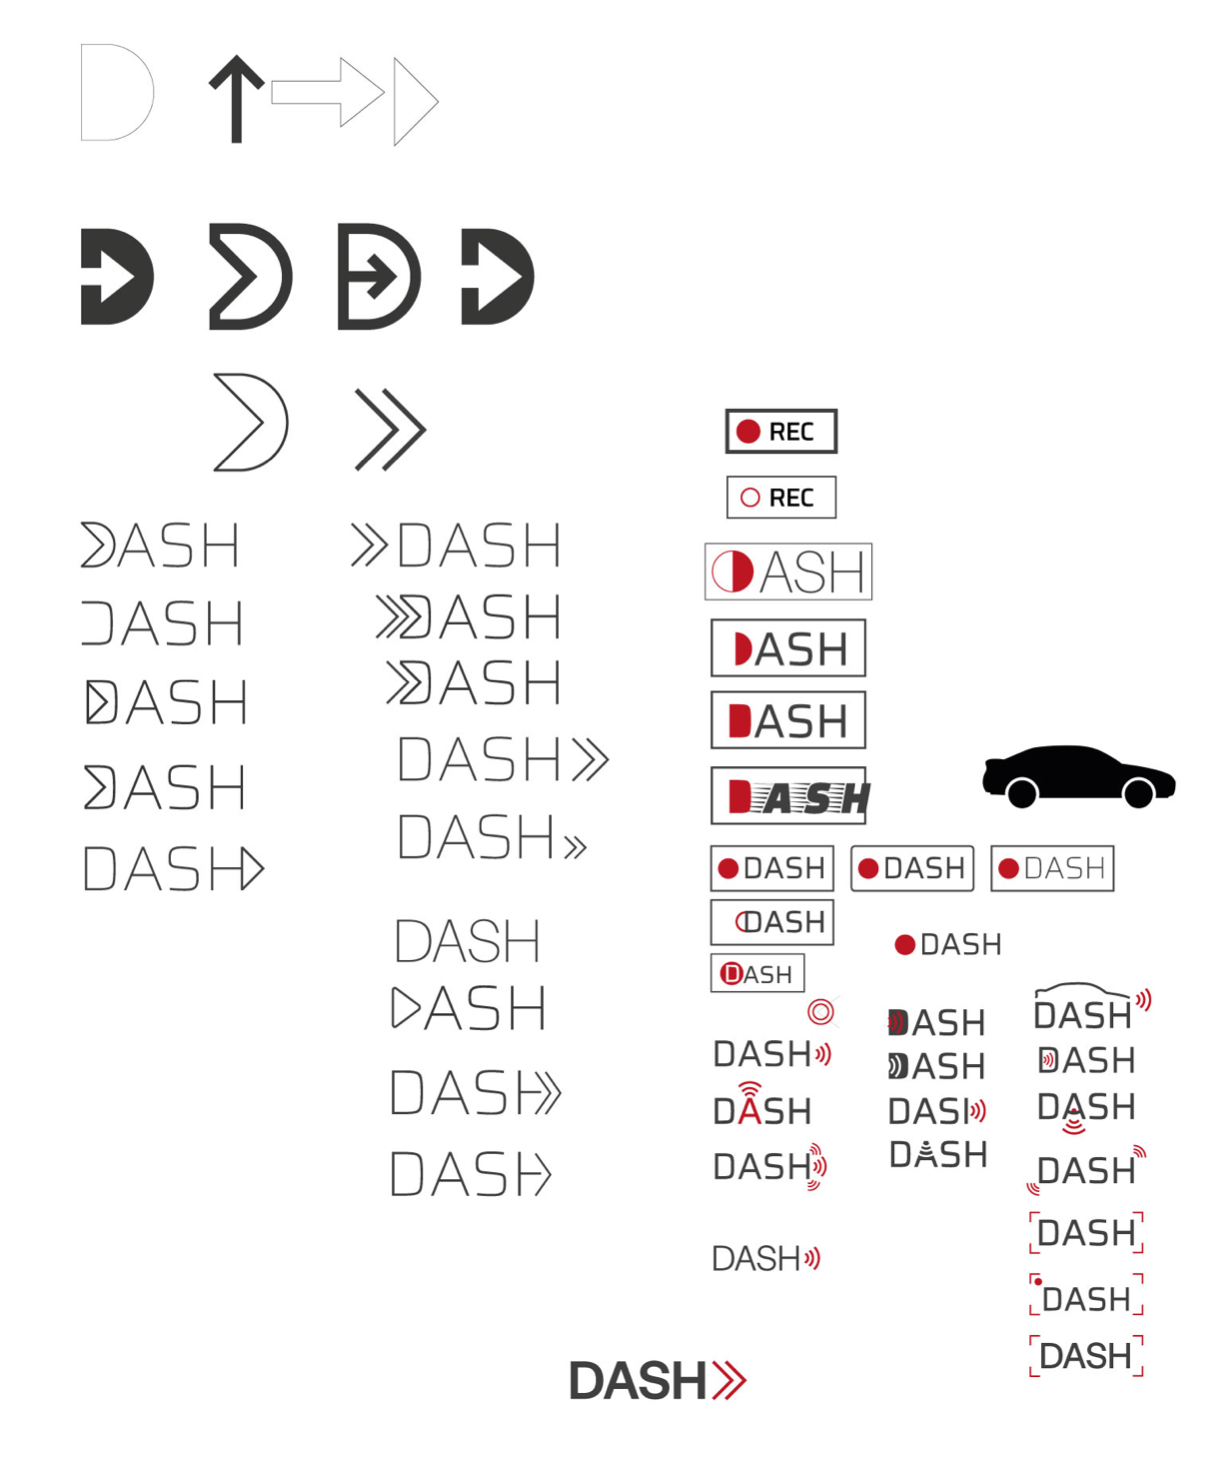
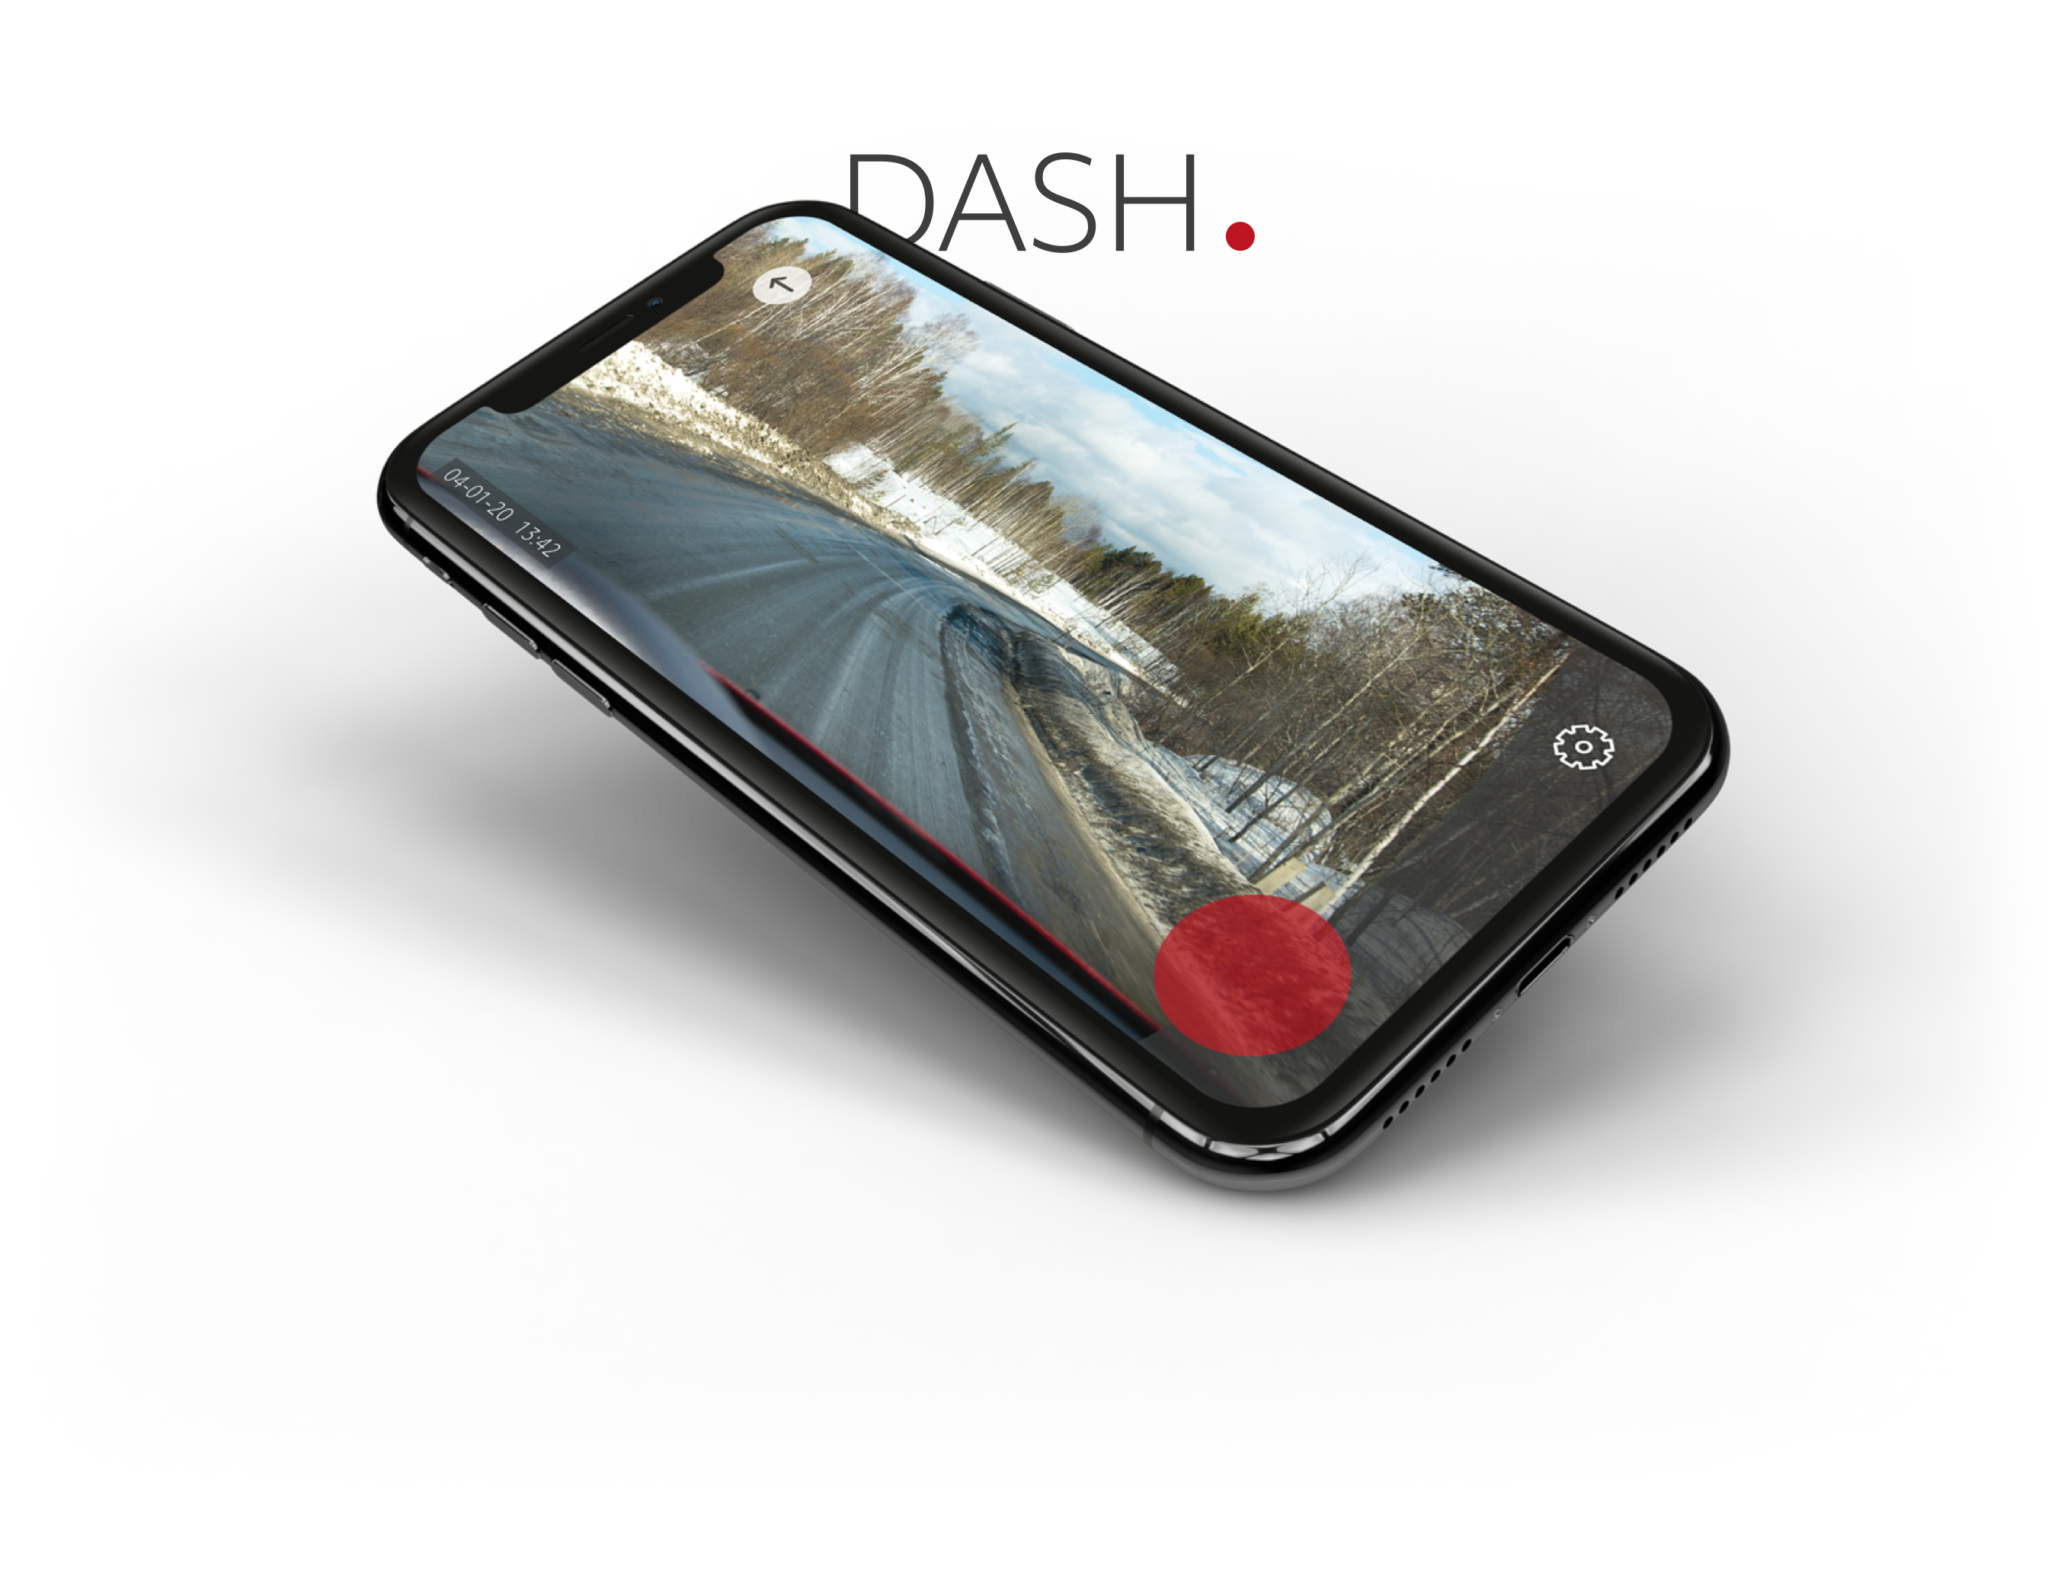
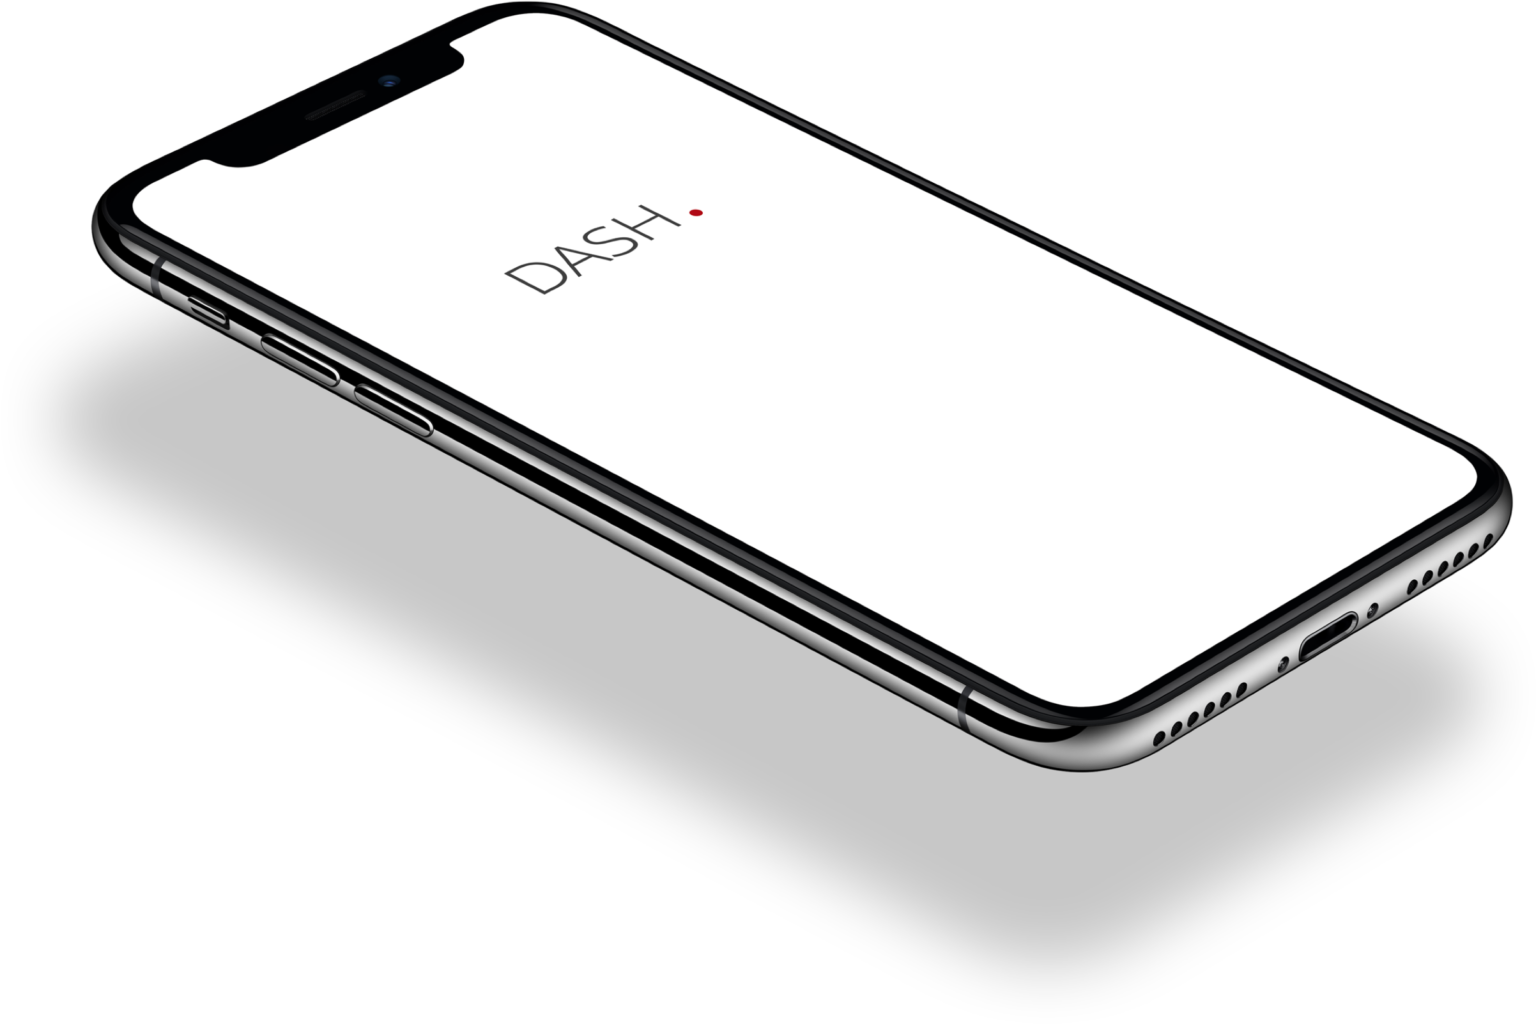
Dash Brand Development
Creating simple yet recognisable branding and icons that users can instantly recognise and associate with the product.
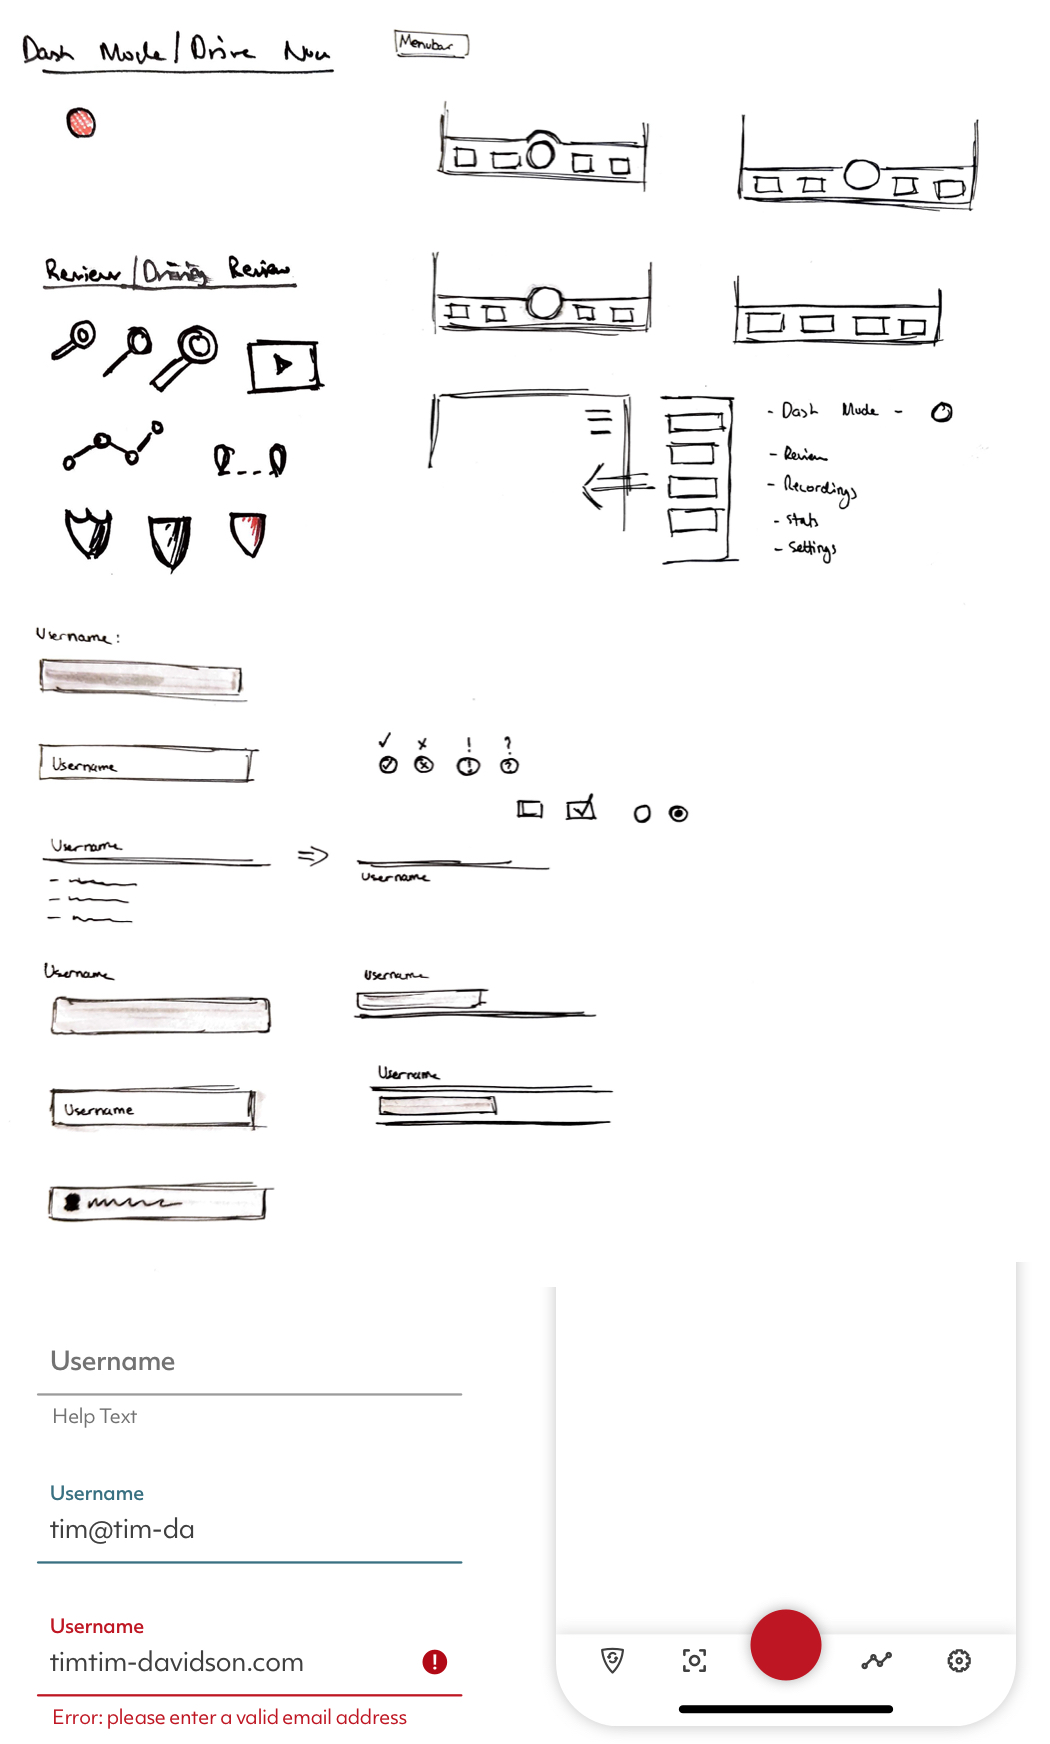
Design System
As the project progressed, there was an increased effort required to ensure that the style and design on various components was kept consistent. To help this, I created an initial design system for the most common components. These were the menubar, form fields, and buttons. Starting with sketches, these developed into digital creations. These were then esily and quickly used throughout high fidelity prototypes whilst keeping visual consistency.
While working through the buttons and form fields it led me to evaluate and refine my colour scheme. I had begun to use a large variation of colours throughout the designs so went back through and reduced to the fewest colours possible to stop any future confusion. As well as this I re-visited my brand colour scheme to update some of the colours very slightly in order to make the accessible when used. All it took was some slight tweaking to make them all at least AA complaint with many being AAA complaint.
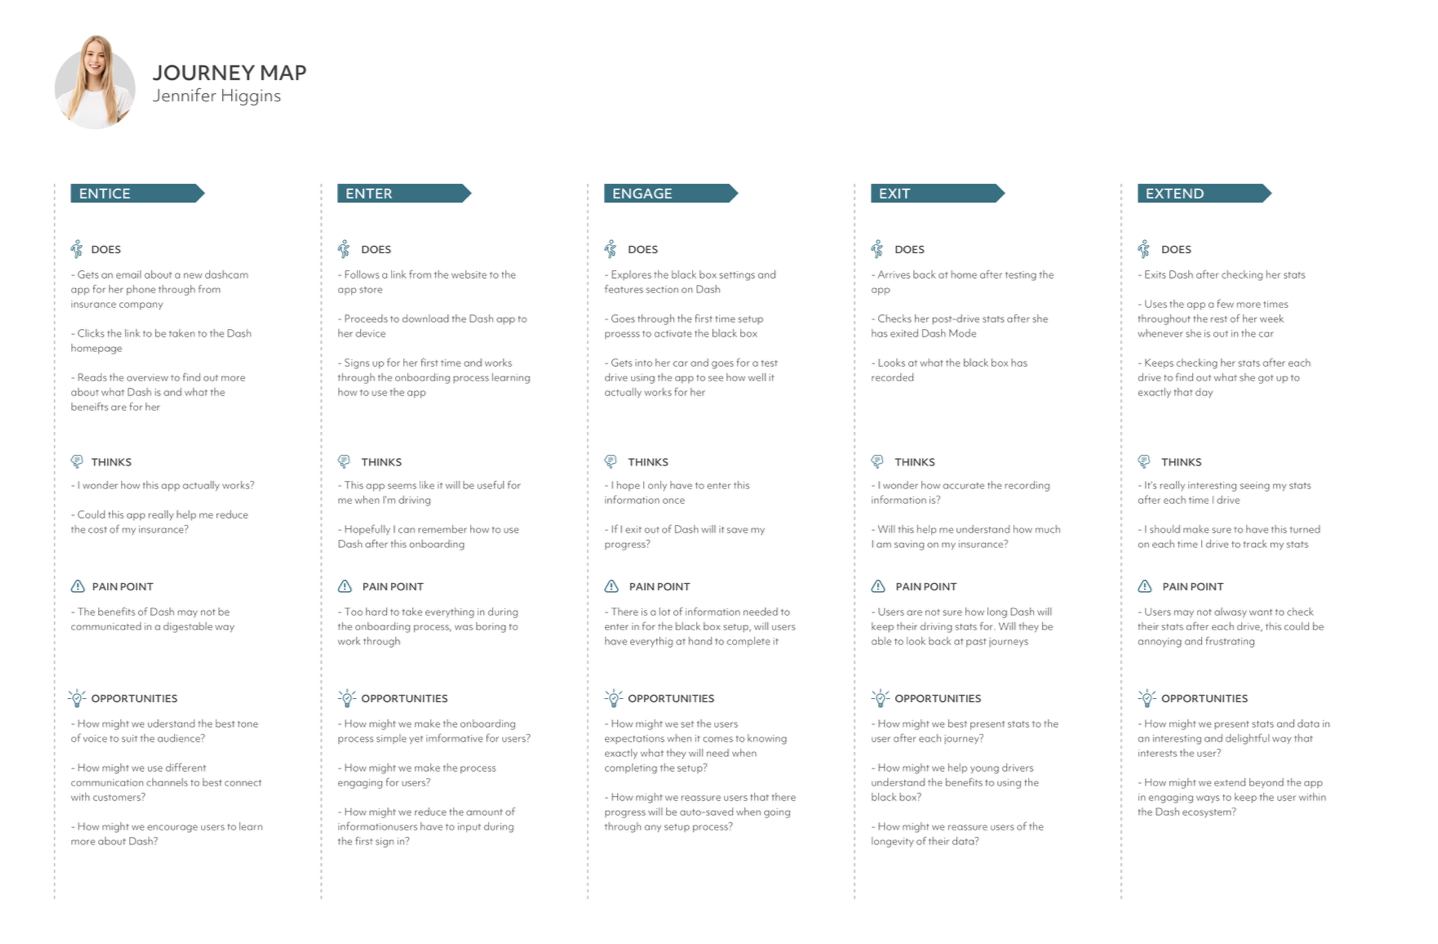
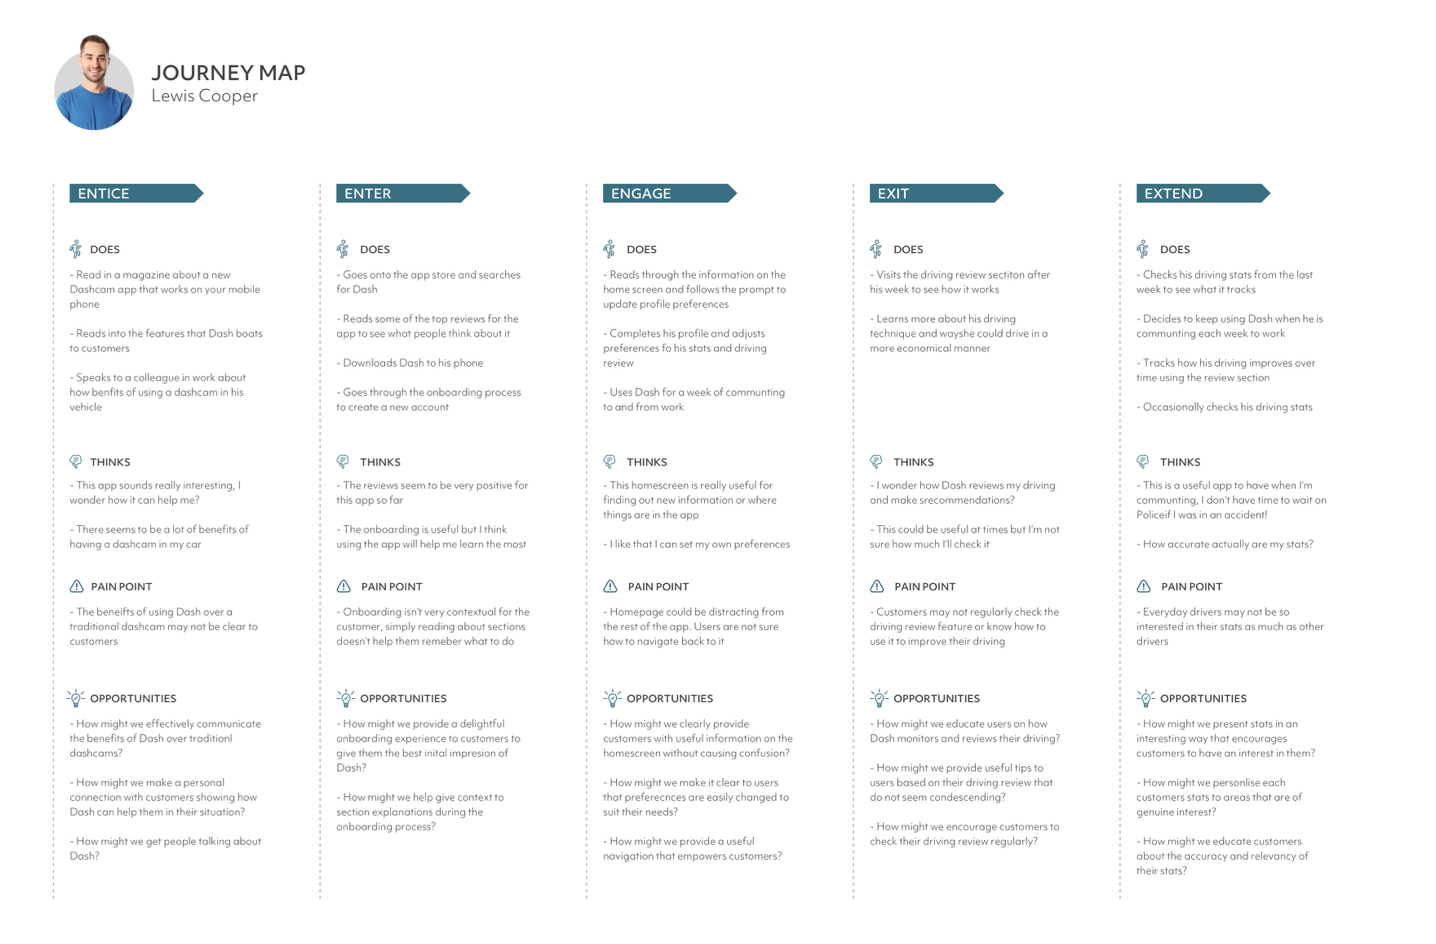
User Journeys
To help shape the features and wireframes of Dash, I created a journey map using Dash’s two personas. The journey maps give an ideal journey through Dash by each user. This helps to give more context for wireframes and a prototype.
My journeys follow the 5E’s: entice, enter, engage, exit, extend. These help to stimulate the narrative across each stage. In each section, the map looks at both the actions and thoughts of each user. From these I could recognise pain points that the user may encounter. These, along with the actions and thoughts, shape the opportunities for Dash. Using ‘How might we…’ statements reframes the problems that occur and help produce valuable solutions that can be implemented to the app.